As organizations travel the road to data-driven transformation, it is important to connect data to derive accurate business context. Here is exactly where graph analytics comes into play. It helps make sense of the underlying data implications and powers analytics to deliver value. Research suggests that the global graph analytics market size is predicted to reach USD 2,522 million by 2024 at a CAGR of 34% during the forecast period.
This blog will cover all the aspects revolving around graph analytics:
- Definition and importance of graph analytics
- Graph analytics vs regular analytics
- Types of graph analytics
- How graph analytics supports higher education
- Business use cases
Keep reading!
What is graph analytics?
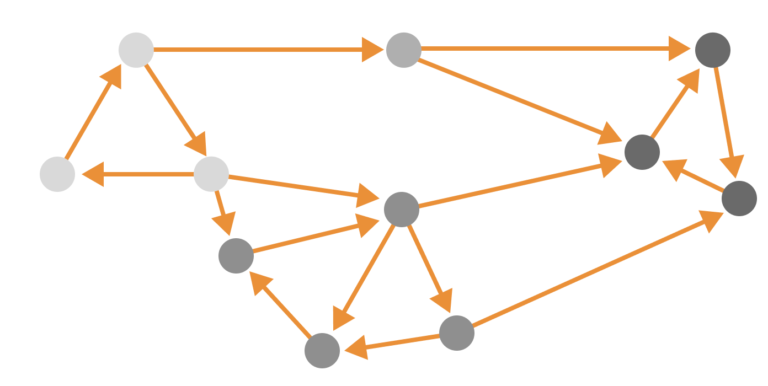
Graph analytics, also known as graph algorithms or network analysis, is the analysis of data in a graph format using data points as nodes and relationships as edges. Nodes signify points or entities Every node and edge hold specific properties that define its characteristics. Graph analytics is used to determine the strength and the direction of connections between objects in a graph. Simply put, graph analytics enables you to store, manage, and query data in the form of a graph. It allows you to find the relationships between people, places, things, events, locations, and others.

Graph analytics tends to provide a pairwise relationship between the objects and represent the structural characteristics of a graph. Moreover, graphs are visually appealing and make it easier to understand how complex networks behave. The best part about graph analytics is the ease with which you can add information to a graph. It is not necessary to understand everything about your data to start storage and investigation.
Some of the most popular tools for graph analytics include Neo4j, OrientDB, Amazon Neptune, and several others.
Graph analytics vs regular analytics
Regular analytics is largely based on statistics, computer programming, and operations exploration. Graph analytics, on the other hand, is based on graph-specific algorithms to analyze the relationships between entities.
Also, regular analytics uses SQL to retrieve data and find reasons behind data insights. The SQL joins are slow due to multiple joins in tabular tables. The SQL queries might take thousands of milliseconds to show results. On the contrary, graph analytics leverages graph databases. In a graph database, all the nodes are connected by relationships. Hence, it tends to show faster results than SQL queries.
Types of graph analytics
Graph analytics can be categorized into four main types. Let’s have a quick look at them.
1. Path analysis
Path analysis tends to focus on the relationships between two nodes in a graph. It determines the shortest distance between two nodes and analyzes similar shapes and distances from different paths that connect entities within the graph.
2. Connectivity analysis
Connectivity analysis is used to determine the strength of two interconnected nodes. It helps you identify whether the connection between the nodes is strong or weak. Connectivity analysis also determines the number of edges flowing into the node and the ones flowing out of the node.
3. Centrality analysis
It tends to determine the importance of a present node within the graph network and its connectivity to others. Centrality analysis enables you to understand the most influential node and the connection it accesses.
4. Network analysis
Network analysis, also known as, community analysis tends to define the density of relationships between nodes. It helps you learn about the nodes that frequently interact with each other in a graph network. Network analysis also enables you to determine if the connecting edges are transient. It tends to predict whether the created graph network will grow or not.
How graph analytics works
Graph analytics tends to use graph specific algorithms to analyze relationships between entities. Let’s have a look at those algorithms one by one:
1. Clustering
It groups objects based on their similar characteristics. Customized categorization of graph data is simpler with clustering.
2. Partitioning
Partitioning, also known as cutting, finds the cut with the fewest number of crossing edges.

3. Shortest path
It finds the shortest path between two nodes of interest. It can be best used for social network analysis and solving optimization challenges.

4. Connected components
It enables you to get to every node in the graph from any starting node. The connected components are the maximal sub-regions of a graph.

Implementing graph analytics in higher education
Various higher education institutions are expressing the need for technologies to track students’ end-to-end journeys and enhance experiences. In such scenarios, graph databases come to the rescue. They help educators to analyze and connect different learner data and deliver personalized experiences.
1. Create personalized learning experiences
Academic professionals can create a knowledge graph using a graph database. The knowledge graph will provide a conceptual framework for different courses and help manage students and their progress. Storing students’ information and learning resources as graphs enables academic institutions to facilitate learning more holistically

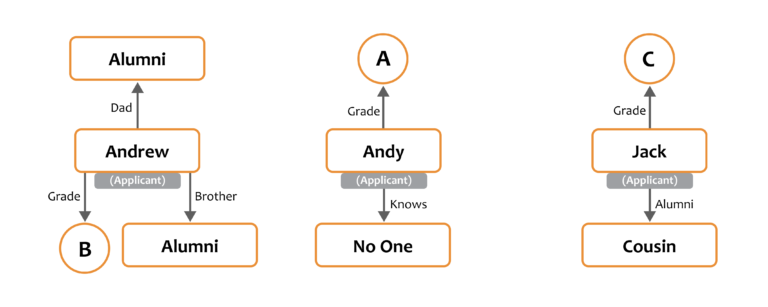
2. Rank and score applicants
Graph analytics makes it easier to fast-track screening processes for different applicants. Here’s a pictorial representation of the same.

3. Facilitate better student engagement
Let’s understand this with the help of an example. Imagine that a university needs to invite certain students to celebrate the introduction of a new football training facility. On what basis should it choose the students? How should the university data be filtered? It’s simple. The university can filter based on age, affiliation with football, and alumni status. When such data is stored in a graph, identifying accurate information becomes easier and quicker.
Graph analytics works wonders for alumni engagement as well. Think of a university that is looking to track alumni engagement on the basis of time, talent, and resources.

The above graph can easily help derive the following insights:
- John is a generous donor to social welfare events.
- Nick is an active event organizer.
- Tom is an influencer and attracts the crowd with his powerful speeches.
Some more business use cases of graph analytics
Apart from higher education, graph analytics can be applied to various industries and categories such as finance, manufacturing, marketing, data regulation and privacy, and others.
- Graph analytics simplifies fraud detection. All you need to do is create a graph from transactions between entities as well as entities that share information like email addresses, passwords, and more. By running a simple query, you will find all customer accounts with similar information. It will also help discover which accounts are performing cash exchange.
- Social media platforms like Spotify, Instagram, and LinkedIn are connection driven platforms and can leverage graph analytics to generate useful insights. For example, connectivity and community analytics help map out influencers with their followers and subsequently their followers’ connections. It enables you to create word-of-mouth chain effects.
- Graph analytics can also be used for supply chain optimization. With graph analytics algorithms like shortest path and partitioning, you can optimize routes in transportation and supply chain networks.
- Graph analytics helps you trace sensitive data across enterprise systems and also offers a visual picture of the data flowing through various systems. This further enables you to achieve regulatory compliance.
- Graph analytics simplifies fraud detection. All you need to do is create a graph from transactions between entities as well as entities that share information like email addresses, passwords, and more. By running a simple query, you will find all customer accounts with similar information. It will also help discover which accounts are performing cash exchange.
Wrapping up
As businesses continue to push the capabilities of big data, graph analytics should be leveraged to derive insights from complex data networks. Our experts at LumenData can help you adopt graph analytics technologies in a hassle-free manner. Unlock the most relevant nodes and focus on connections that matter. Get in touch with us today.
Authors:

Shalu Santvana
Content Crafter

Subhodip Pal
Senior Data Scientist

Ankit Kumar
Technical Lead

Taniya Pal
Consultant

Shalu Santvana
Content Crafter

Subhodip Pal
Senior Data Scientist

Ankit Kumar
Technical Lead

Taniya Pal
Consultant

Mohit Sharma
Technical Lead

Chakrapani Srinivasan
Director, Sales


